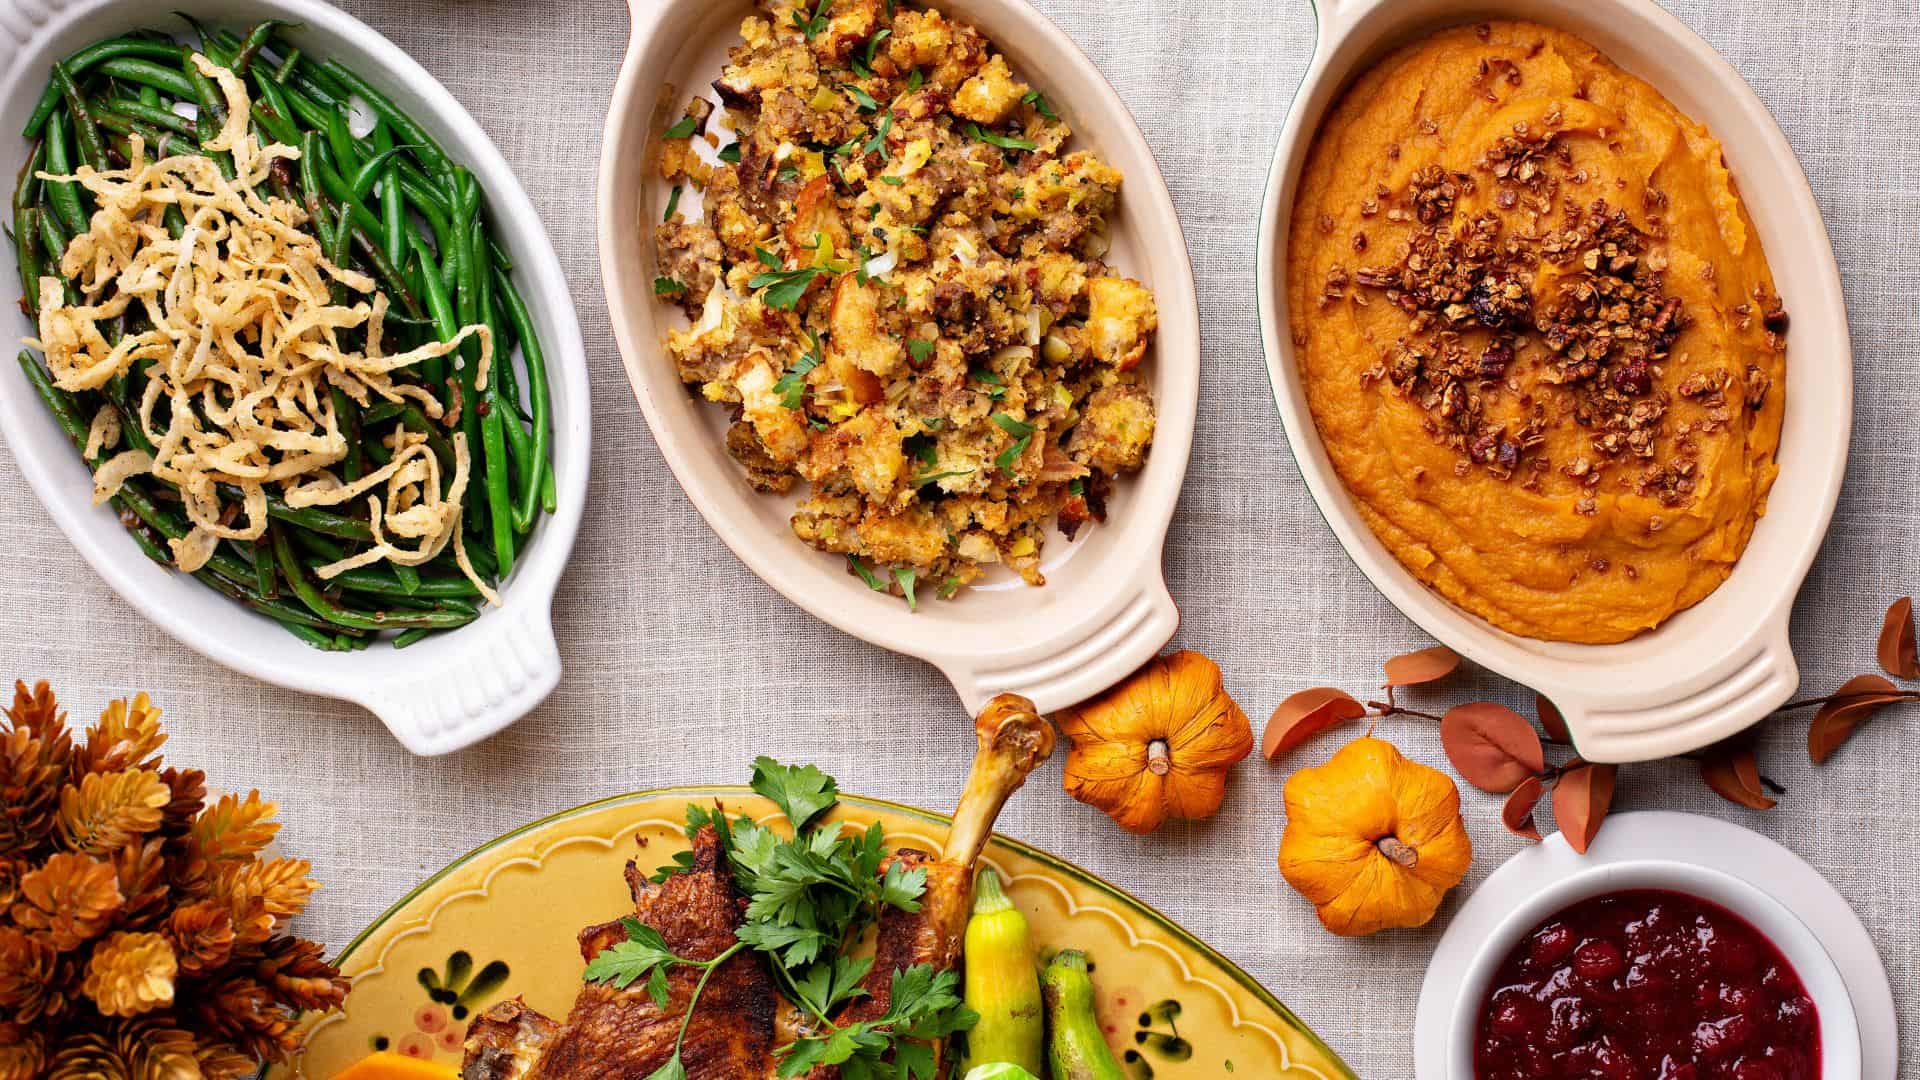
Who’s the real star of Thanksgiving? Sure, you might think of the turkey or your favorite NFL player, but let’s be honest, it’s all about the sides. The creamy potatoes, bubbling casseroles, and beloved family recipes perfected over generations are what truly make the holiday meal unforgettable.
To identify each state’s most-loved Thanksgiving sides, the study analyzed Google search data on interest in more than 30 classic dishes to reveal which dishes dominated kitchens across America.
The most favorite side dishes
The study shows that mashed potatoes, stuffing, and macaroni and cheese are the top three sides overall that families are most likely to serve on a Thanksgiving plate. Mashed potatoes lead with an implied probability of 36.97%, just slightly ahead of stuffing at 36.00%. Macaroni and cheese comes next, with a 32.28% probability.
Other popular dishes include cranberry sauce (21.18%) and sweet potato casserole (19.01%), followed by green bean casserole, gravy, and baked potatoes. These sides continue to appear in most households across regions, with slightly less probability of including cornbread, corn pudding, and Brussels sprouts.
The numbers show that most homes serve more than one main side, with mashed potatoes and stuffing almost guaranteed to share the table.
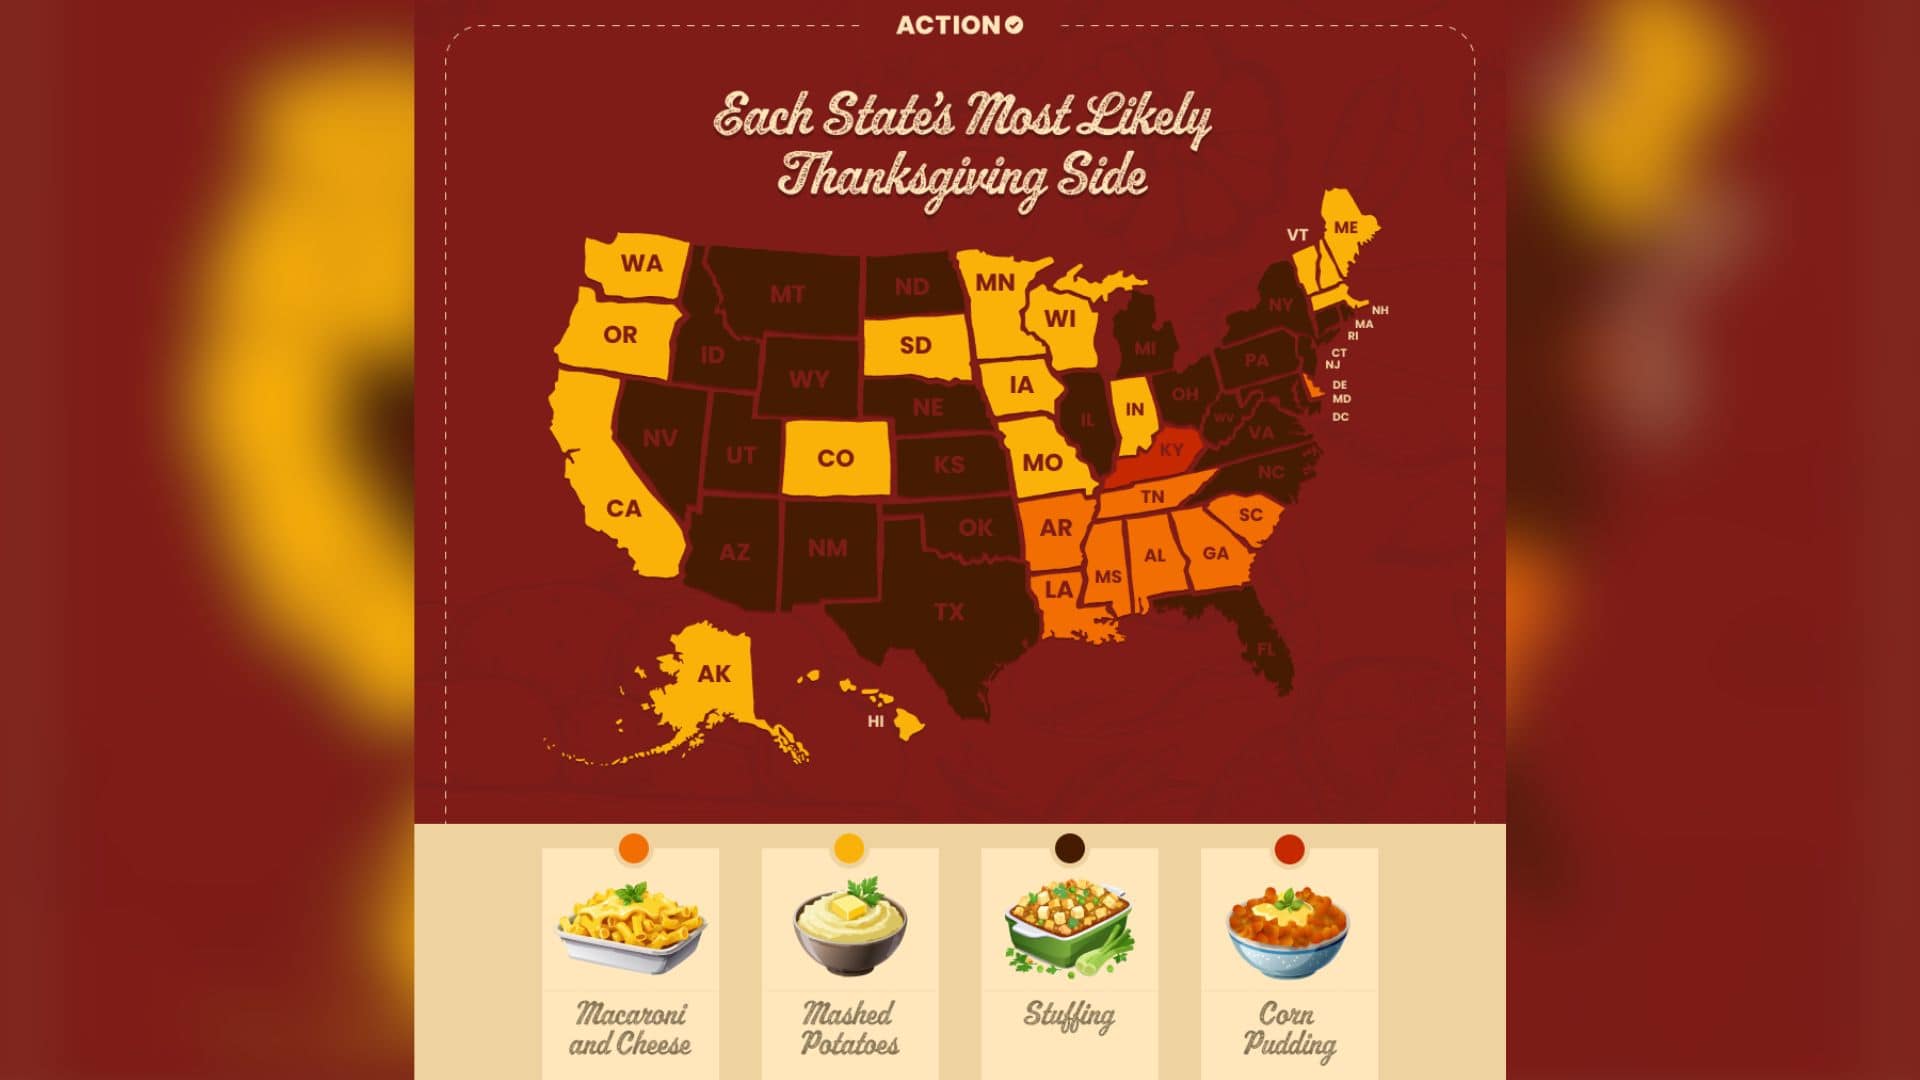
Regional differences: Which Thanksgiving side is each state likely to serve?
Regional habits also shape what Americans eat at Thanksgiving. According to data, stuffing ranks first in 26 states, while mashed potatoes lead in 17.
In much of the Midwest and Mountain West, mashed potatoes is the most common side dish families have on their Thanksgiving table. Southern states tend to lean toward macaroni and cheese, and also cheese casseroles.
Kentucky stands out as the only state where corn pudding is the most likely side dish, with odds of 32.98%. The dish is a long-standing favorite in the region and reflects local food traditions centered on corn-based recipes.
Which state is most likely to serve casserole?
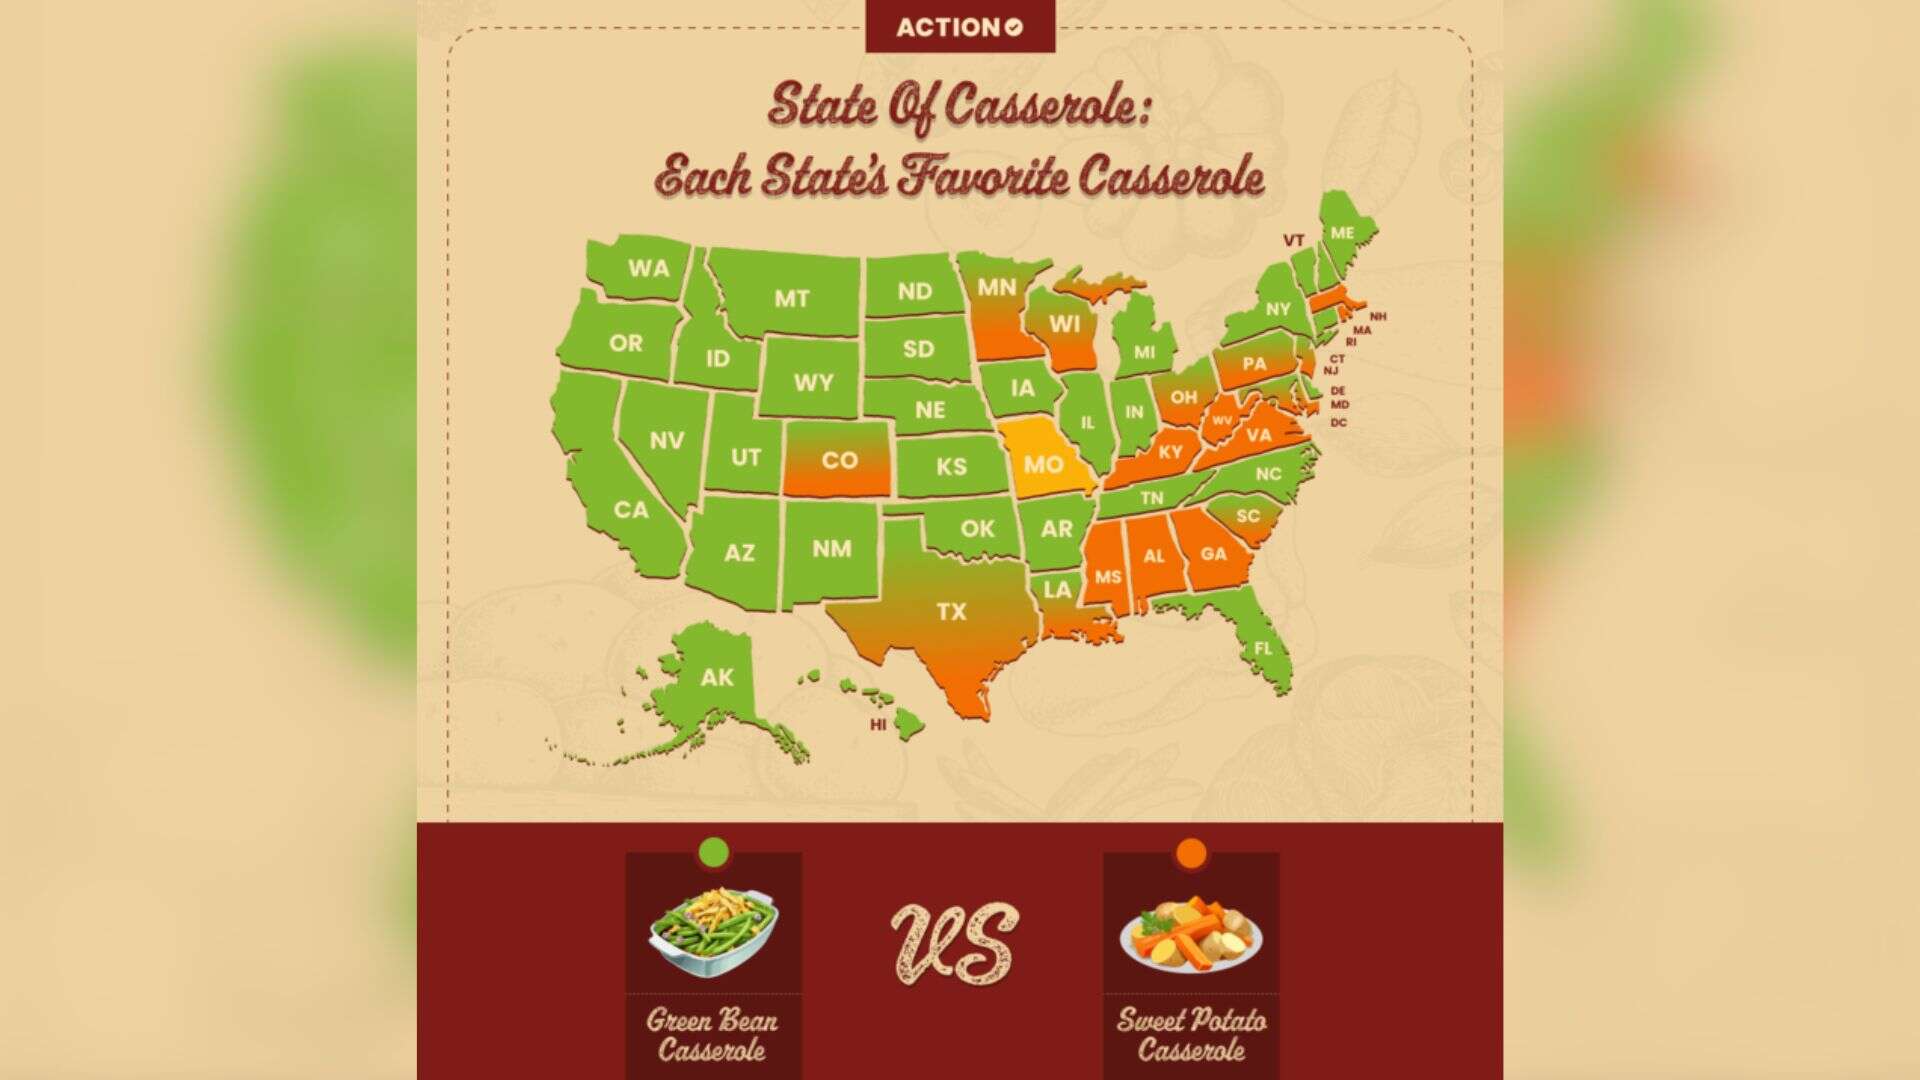
Casseroles remain a major Thanksgiving side dish among many Americans. The data shows that green bean casserole leads in more than 35 states, including California, New York, and Oregon.
Sweet potato casserole is most common in the South, with states such as Georgia, Alabama, Mississippi, Virginia, and Kentucky leading the way. Some states, including Texas, Ohio, and Wisconsin, show almost equal interest in both versions.
These results suggest that casseroles continue to hold a consistent place at Thanksgiving dinners nationwide, regardless of the base ingredient.
Stuffing vs. dressing: Which is served most on Thanksgiving?
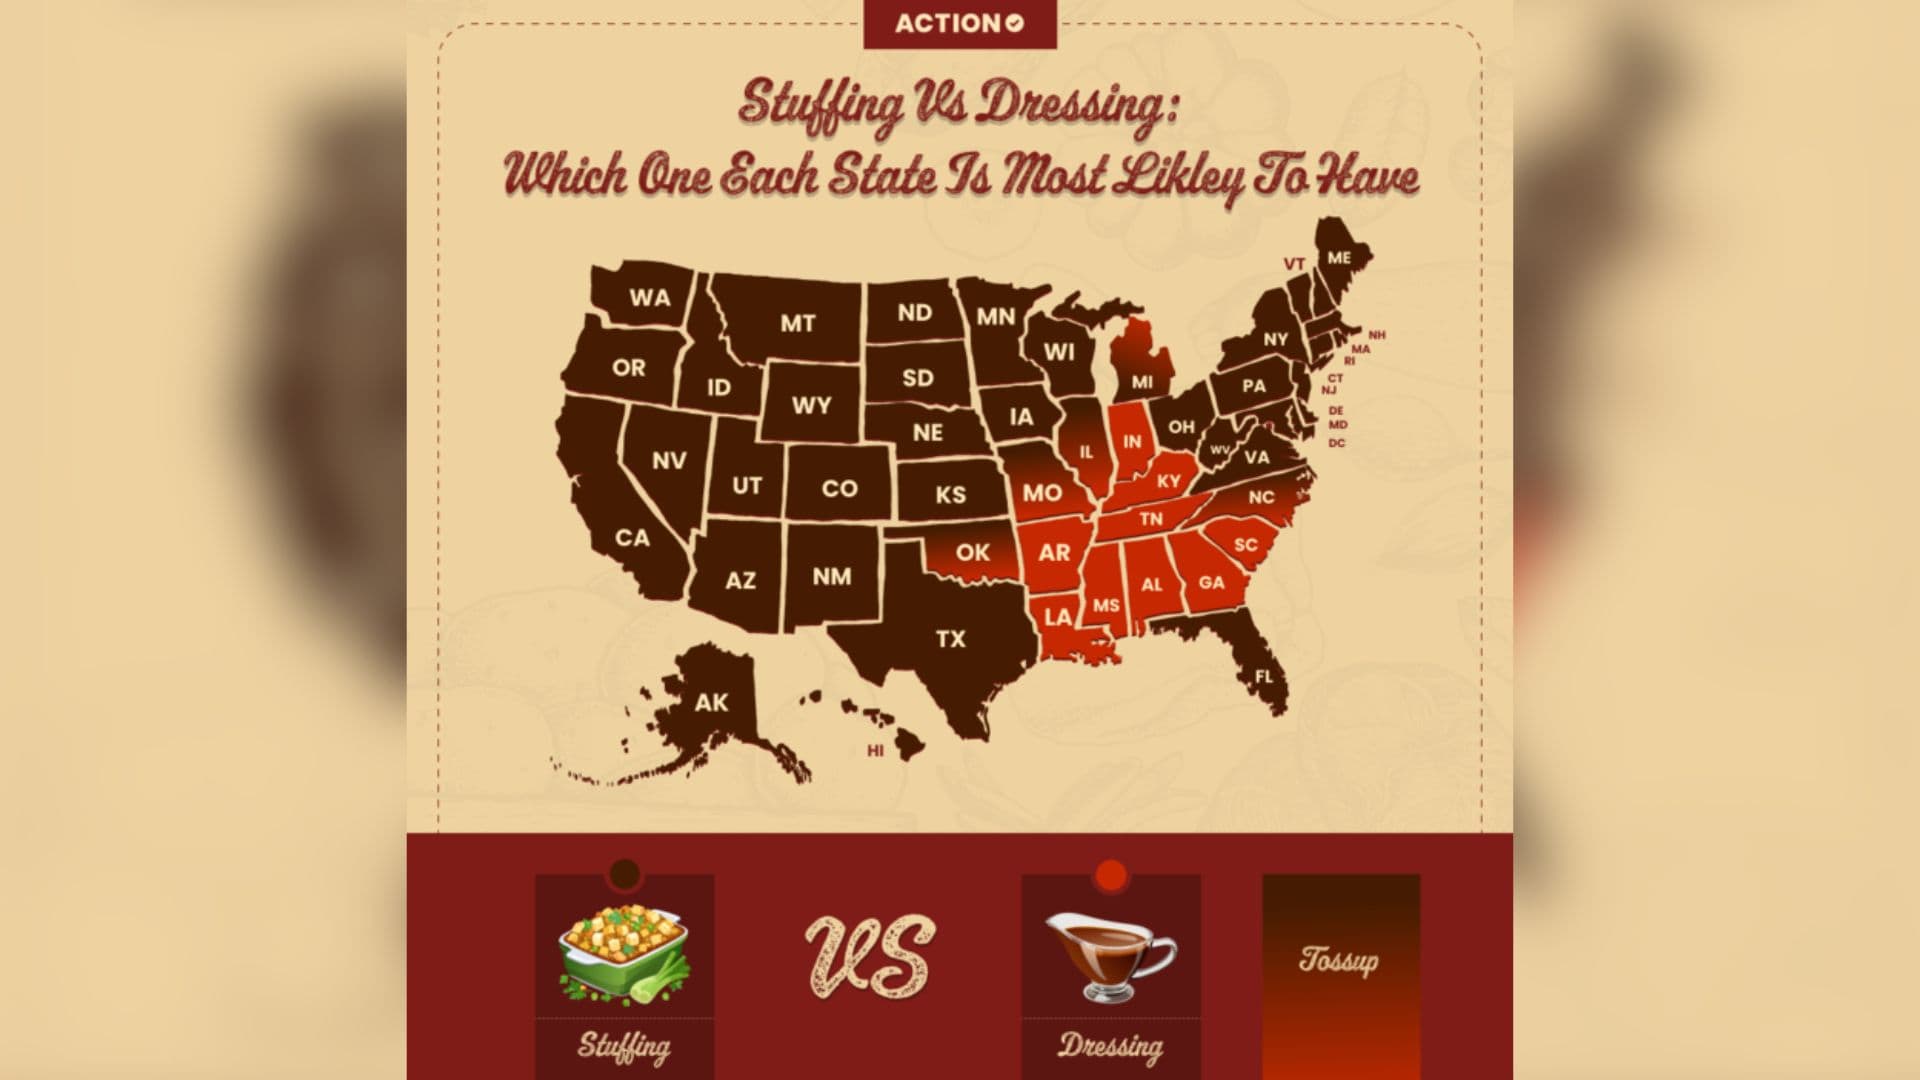
The question of stuffing or dressing still divides the country. Of the 50 US states, 37 prefer stuffing. However, only eight states are likely to serve dressing. Five states, including North Carolina, Illinois, and Oklahoma, are divided on both, showing mixed preferences.
Stuffing dominates in the North and West, where the bread-based version is often baked inside or alongside the turkey. In the South, dressing, usually made with cornbread and cooked separately, remains more common.
Cranberry sauce varies nationally
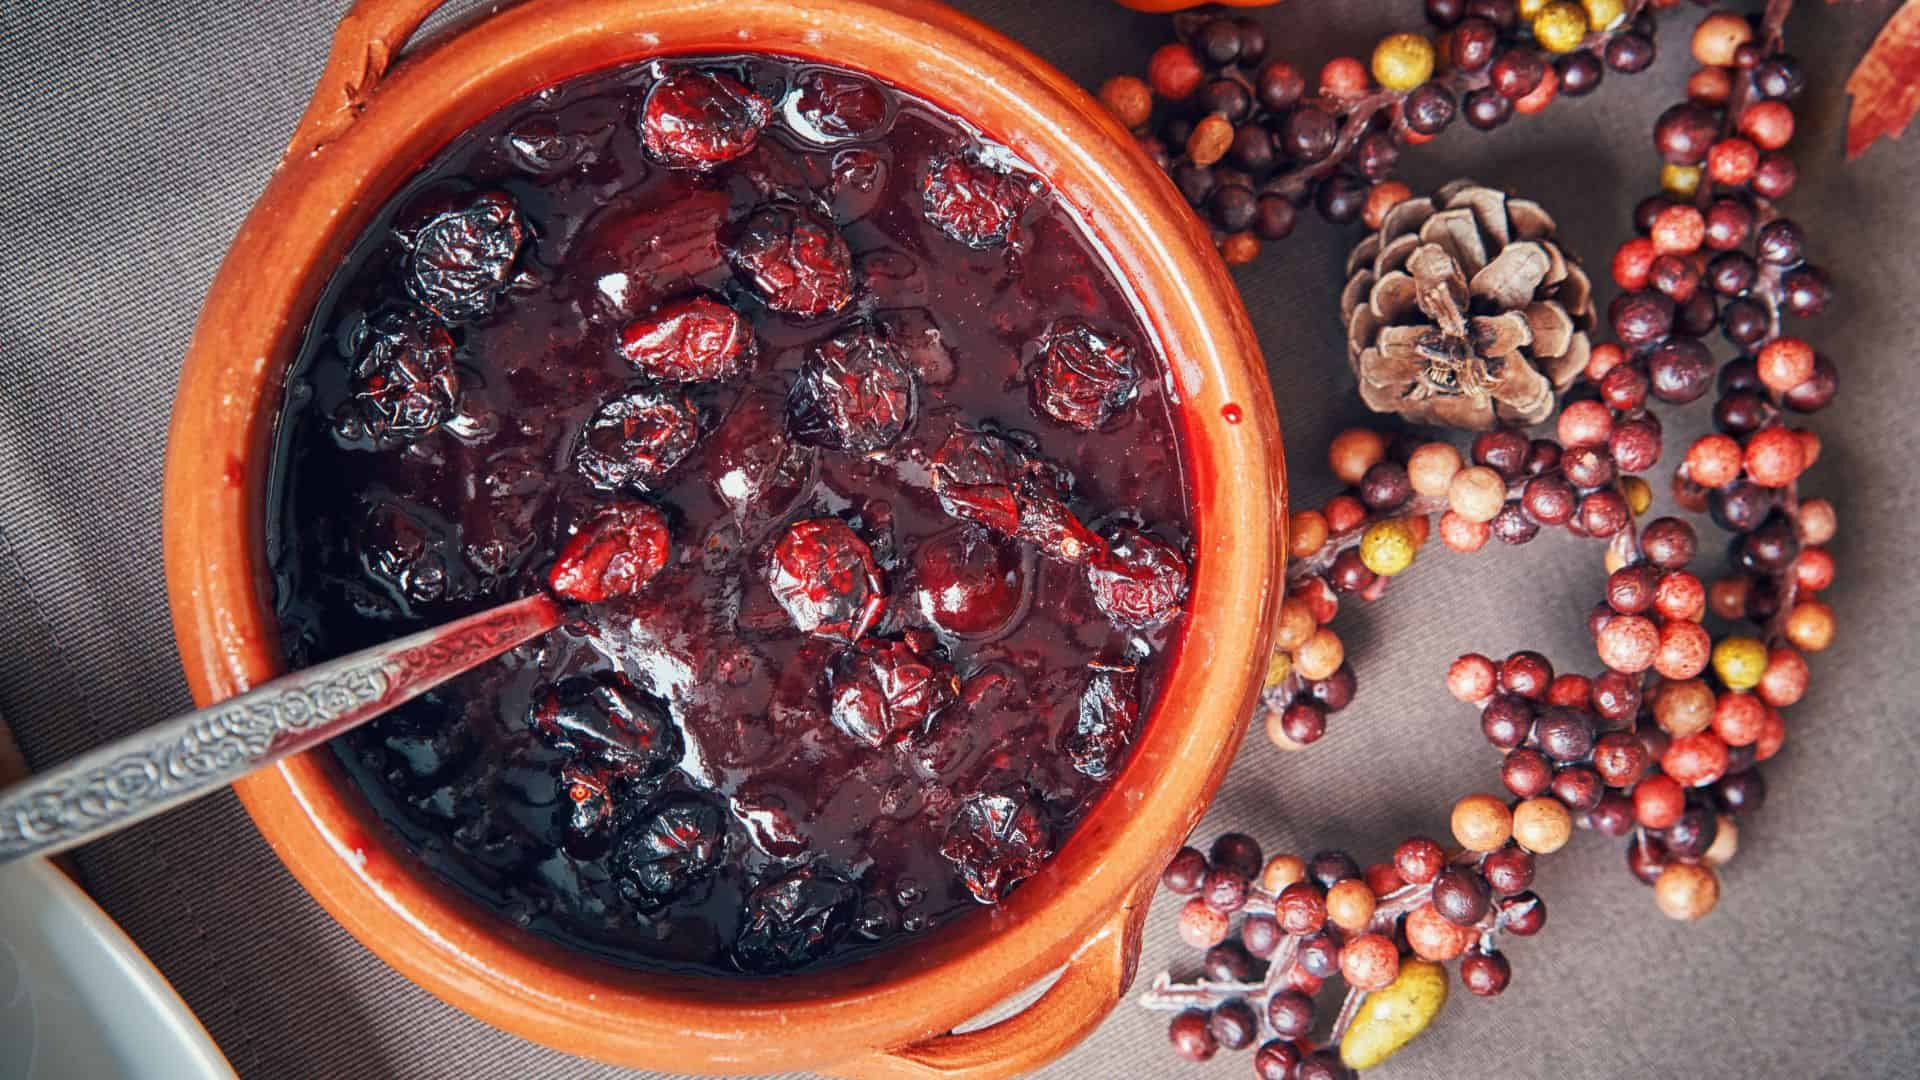
Cranberry sauce continues to divide opinion, but five states stand out for serving it most often. The study lists the following states as having the highest implied probability of the dish appearing on Thanksgiving tables:
Utah: The state ranks first with an implied probability of 29.32 percent and about 185 searches per 100,000 residents. Stuffing remains Utah’s overall favorite, but larger family sizes make cranberry sauce a frequent addition to most gatherings.
Hawaii: With a 26.86-percent likelihood and roughly 15 searches per 100,000 residents, Hawaii’s results suggest that even with fewer recipe searches, the dish still appears on many tables alongside traditional Thanksgiving foods.
California: The state shows a 26.84 percent probability and about 187 searches per 100,000 residents. While mashed potatoes remain the leading side, cranberry sauce continues to hold a regular place at California’s Thanksgiving dinners.
Massachusetts: At 25.28 percent and about 205 searches per 100,000 residents, Massachusetts keeps cranberry sauce on the Thanksgiving table. As one of the country’s major cranberry-growing regions, it maintains a strong connection to the dish.
Vermont: The state records a 24.70 percent chance and around 200 searches per 100,000 residents. Smaller households and traditional cooking habits help keep cranberry sauce a consistent part of local Thanksgiving menus.
The data show that both population size and agricultural history affect the likelihood of cranberry sauce appearing on holiday menus. States with larger households or cranberry production tend to serve it more often.
Overall Thanksgiving side dishes across the United States
The Thanksgiving Side Odds chart shows how much Americans rely on familiar, hearty foods. Mashed potatoes, stuffing, and macaroni and cheese are on most tables, and most households prepare at least 2 or 3 sides.
Southern states often prefer dishes made with corn or sweet potatoes, while the Midwest leans toward potato-based sides. Western states show a mix of both, likely influenced by population diversity and cooking variety.
Even sides with lower odds, like gravy (10.93%), baked potatoes (10.93%), and butternut squash (10.84%), remain part of many Thanksgiving meals. The data suggest that most Americans stick to traditional comfort foods that can feed large groups.
Across all 50 states, Thanksgiving side dishes remain a mix of shared favorites and local traditions.
Methodology
The Action Network used Google Keyword Planner data for November searches across more than 30 side dishes. Those figures were combined with information on average family size and common Thanksgiving meal patterns.
Because not everyone searches for recipes they already know, the study gave more weight to traditional dishes identified in Campbell’s and Google’s Thanksgiving reports. Sides like mashed potatoes, stuffing, macaroni and cheese, cranberry sauce, and gravy were adjusted to reflect their consistent appearance in holiday meals.
Family-size data from the U.S. Census Bureau were also used, since larger households tend to cook more sides. Each dish’s implied probability represents a modeled estimate of how likely it is to appear on the average Thanksgiving table.
These numbers are cultural indicators of what people are most likely to serve.
Leave a Reply